
Most investors know the S&P 500 intimately, it is the benchmark printed on every fund statement, cited in every news segment, and used as the yardstick against which all other investments are measured.
But tucked beneath it, largely ignored by financial media, is the S&P SmallCap 600: an index of 600 smaller American companies that has, over its 30-year history, frequently surprised large-cap devotees.
The question is not simply "which index is better." It is a more interesting one: what are you actually buying when you choose one over the other, when do small caps win and when do they lose, and how should these two indices coexist in a thoughtful portfolio?
Table of Contents
Sector Composition: Where They Differ Most
The two indices are not just differently-sized versions of the same portfolio. Their sector compositions diverge significantly, which explains much of the performance gap since 2017.
The S&P 500's heavy technology weighting, anchored by the Magnificent Seven, is simply not replicated at the small-cap level.
Sector Allocation Comparison
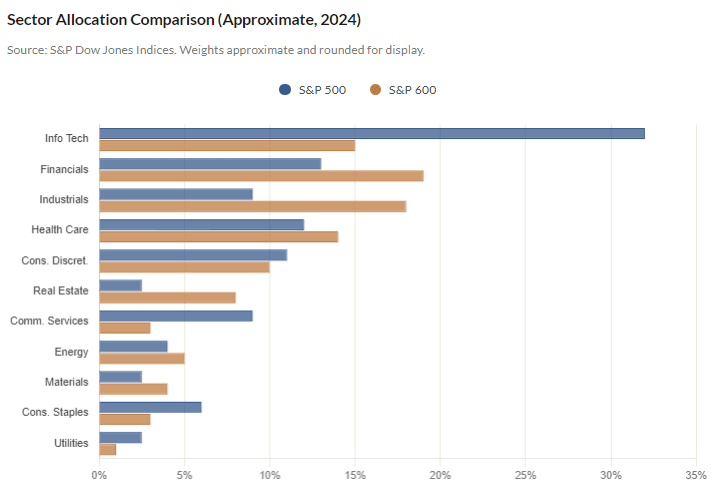
The S&P 500 is, in many ways, a technology index with other things in it. Nearly a third of its weight sits in Information Technology.
The S&P 600 is far more economically diversified; overweight in Industrials, Financials, and Real Estate, sectors that historically do well when interest rates normalize, the economy grows domestically, and credit spreads tighten.
This is why small-cap investors often argue the S&P 600 is a purer play on the American domestic economy.
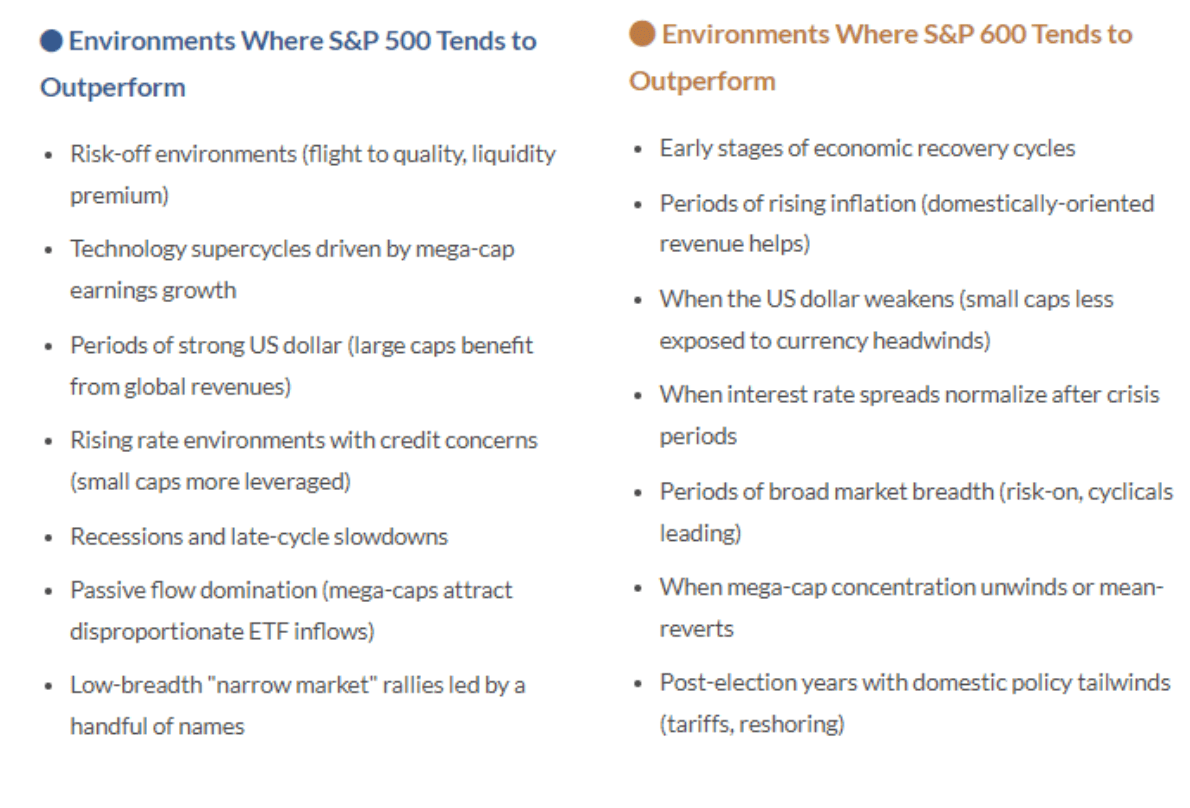
When Small Caps Win, and When They Don't
Decades of research on the small-cap premium have produced a nuanced picture. Small caps do not simply outperform in all environments.
Their advantage is conditional, cyclical, and often tied to specific macroeconomic regimes.
Valuation: The Discount Argument
One of the most frequently cited arguments for small caps today is valuation.
After years of underperformance relative to mega-cap growth, the S&P 600 trades at what many strategists describe as an unusually wide discount to the S&P 500, a gap not seen consistently since the 2010–2012 period.
Valuation alone is not a timing tool. Cheap assets can remain cheap for extended periods, as small-cap investors discovered between 2017 and 2024.
But a 30%+ discount to the S&P 500 on a forward earnings basis is significant enough that most long-term investors should at minimum consider whether the risk/reward trade-off has become more favorable than recent performance history suggests.
The more important valuation question is what drives mean reversion.
Historically, the discount compresses when: mega-cap concentration unwinds, earnings growth broadens beyond tech, or cyclical and domestic-oriented sectors re-rate upward. All three are plausible over a 3–5 year horizon.
The Bottom Line
The S&P 500 has been the undisputed winner of the past decade, and the reasons are real: technology dominance, passive flow concentration, and global earnings power are genuine structural advantages.
Anyone who dismisses large-cap investing because of valuation or mean-reversion arguments has been repeatedly humbled.
But the S&P 600 is not simply a diluted version of the same trade. It is a portfolio which is more domestic, more economically diverse, more sensitive to the actual business cycle, and carries a quality earnings screen that distinguishes it from other small-cap benchmarks.
The 30%+ valuation discount it currently trades at relative to the S&P 500 is not a guarantee, but it is a meaningful input for any investor thinking in 5–10 year increments rather than quarters.
"The question is not which index will win next year. It is whether you are structurally exposed to the parts of American capitalism that will benefit from the next cycle — wherever it comes from."

