
When central banks inject liquidity into the financial system, equity markets respond, but not immediately, and not uniformly.
The transmission mechanism from money supply expansion to stock price appreciation operates through predictable channels, with measurable lag times that create actionable investment opportunities for those who understand the mechanics.
Global M2 (the broad measure of money supply that includes cash, savings, and money market funds) money supply, which includes cash, checking deposits, savings accounts, and money market funds from the world's major economies, has reached approximately $123 trillion as of late 2024.
The combined M2 of the United States, China, Eurozone, and Japan, which together represent roughly 70% of global liquidity, drives asset price movements across developed and emerging markets. The relationship is neither mysterious nor arbitrary: more liquidity lowers the opportunity cost of holding risk assets and provides the fuel for portfolio expansion.
Table of Contents
The Transmission Mechanism: From Central Bank to Stock Portfolio
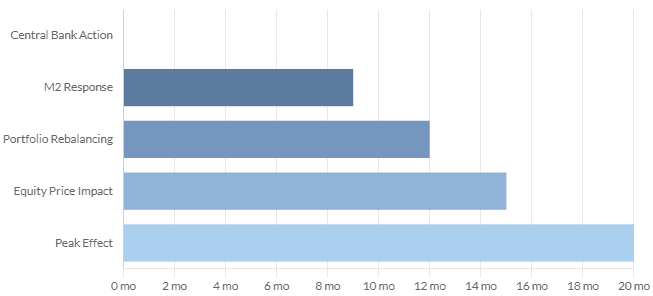
The journey from central bank balance sheet expansion to equity price appreciation follows a multi-stage process with measurable timing. Changes in central bank balance sheets typically take six to twelve months to influence M2 aggregates.
Once M2 begins expanding, the impact on financial markets occurs within an additional three months. The total lag from initial monetary policy action to peak equity market effect ranges from nine to twenty months, depending on market conditions and the specific transmission channels at work.
The mechanism operates through portfolio rebalancing decisions made by institutional and individual investors. As liquidity expands, investors holding cash face declining real returns due to inflation and negative real rates. This forces a shift toward higher-yielding assets.
Risk-on assets, particularly growth stocks, technology equities, and emerging market securities benefit disproportionately because their valuations depend more heavily on abundant liquidity and low discount rates.
The transmission also depends on the composition of liquidity between private sources (commercial bank lending) and public sources (central bank operations). Private liquidity proves more volatile and pro-cyclical, expanding rapidly during boom periods and contracting sharply during stress. Official liquidity from central banks provides more stable support but moves more slowly through the financial system.
Regional Divergence: How M2 Expansion Affects Different Markets
Not all equity markets respond identically to global liquidity expansion. Developed markets with deep, liquid capital markets and stable currencies tend to see more immediate liquidity absorption.
The United States, with its $22 trillion M2 (representing 44% of the four major economies), exerts outsized influence on global liquidity conditions. When U.S. M2 expands, dollar liquidity flows cross-border into emerging markets seeking higher returns, driving outperformance in countries like Brazil, India, and several Asian economies.
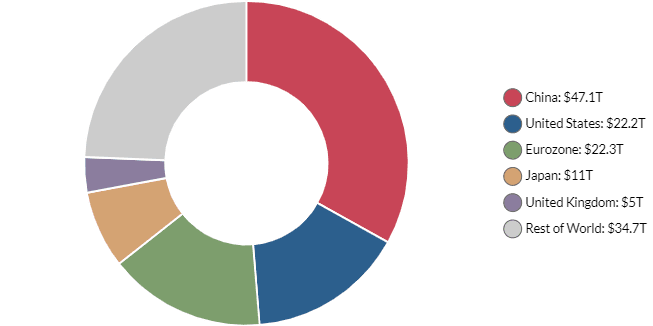
China's M2, at approximately $47 trillion (the largest globally at 33% of the total), operates somewhat independently due to capital controls and a more closed financial system.
Changes in Chinese liquidity primarily affect domestic markets and commodity-exporting nations in Latin America and Africa that supply China's industrial base. Eurozone M2, at $22 trillion, influences European equities and periphery markets in Eastern Europe through banking system linkages.
Emerging markets demonstrate particularly strong responsiveness to global M2 cycles due to their dependence on cross-border capital flows.
During Fed easing cycles, assuming no recession, emerging market equities have historically risen by an average of 28% in the year following the first rate cut. The mechanism is straightforward: Fed easing increases dollar liquidity, weakens the dollar, reduces EM financing costs, and drives portfolio flows into higher-yielding markets.
Limits to the Liquidity Theory
While the liquidity-equity relationship is robust, it's not deterministic. Several factors can disrupt or delay the transmission mechanism. Structural shifts in market composition matter; the rise of AI-driven technology stocks in 2023-2024 created performance disconnected from traditional liquidity cycles as fundamental earnings growth dominated.
Major geopolitical events or financial crises can override liquidity signals, as happened during the March 2020 COVID shock when markets crashed despite ongoing Fed liquidity provision.
The 2025 experience, where global liquidity increased but equity markets initially diverged illustrates how fundamental factors can temporarily overwhelm liquidity effects.
Valuation extremes, particularly in U.S. technology stocks, profit-taking dynamics, and shifting sector leadership can dominate near-term price action even as longer-term liquidity trends remain supportive.

