
The case for owning developed market equities outside the United States has shifted from a contrarian position to a straightforward valuation argument.
The S&P 500 currently trades at a trailing price to earnings ratio of roughly 30 times, more than its own long term historical mean, approximately 56% above the multiple on the MSCI World ex USA universe.
At the same time, consensus earnings growth expectations for the United States and international developed markets have converged to near parity, running at roughly 12 to 13% in both 2026 and 2027. The fundamental justification for paying a large premium to own US equities has narrowed considerably.
There is also a structural portfolio argument. Standard MSCI World is approximately 70 to 72% US weighted. An investor in a broad MSCI World tracker is not making a deliberate geographic allocation decision.
They are following market cap momentum, which over the last 15 years has systematically increased US concentration from roughly 50% to over 70%. The correlation between MSCI World ex USA and the S&P 500 is approximately 0.78, high, but low enough to deliver genuine portfolio benefit during US specific drawdowns, dollar weakness cycles, and periods of sector rotation away from large cap technology.
MSCI World itself correlates at 0.96 with the S&P 500, offering almost no diversification beyond it.
A 15 to 25% allocation to developed ex US equity within the equity sleeve is a structurally sound position that most portfolios currently underweight by design or default. The question that remains is which instrument to use.
Table of contents
- The Index Landscape
- The Full ETF Menu
- Historical Annual Returns
- The Valuation Gap in Numbers
- Macro Lens Takeaway
The Index Landscape: What Each Benchmark Actually Tracks
Before selecting an ETF, it is worth understanding that "developed ex US" is not a single index, it is a family of overlapping but meaningfully different benchmarks. The three main providers are MSCI, FTSE Russell, and S&P Dow Jones Indices, and each makes different classification decisions about South Korea, Canada, and the small cap tier.
The Canada question is the most material distinction for most investors.
At roughly 12% of the MSCI World ex USA index, Canada carries significant weight through Royal Bank of Canada, Shopify, Canadian Natural Resources, and a cluster of materials and energy names. In 2026, including Canada has been a performance tailwind.
The South Korea question is less impactful in weight terms (3 to 4%) but matters directionally through Samsung Electronics and the semiconductor supply chain exposure it brings.
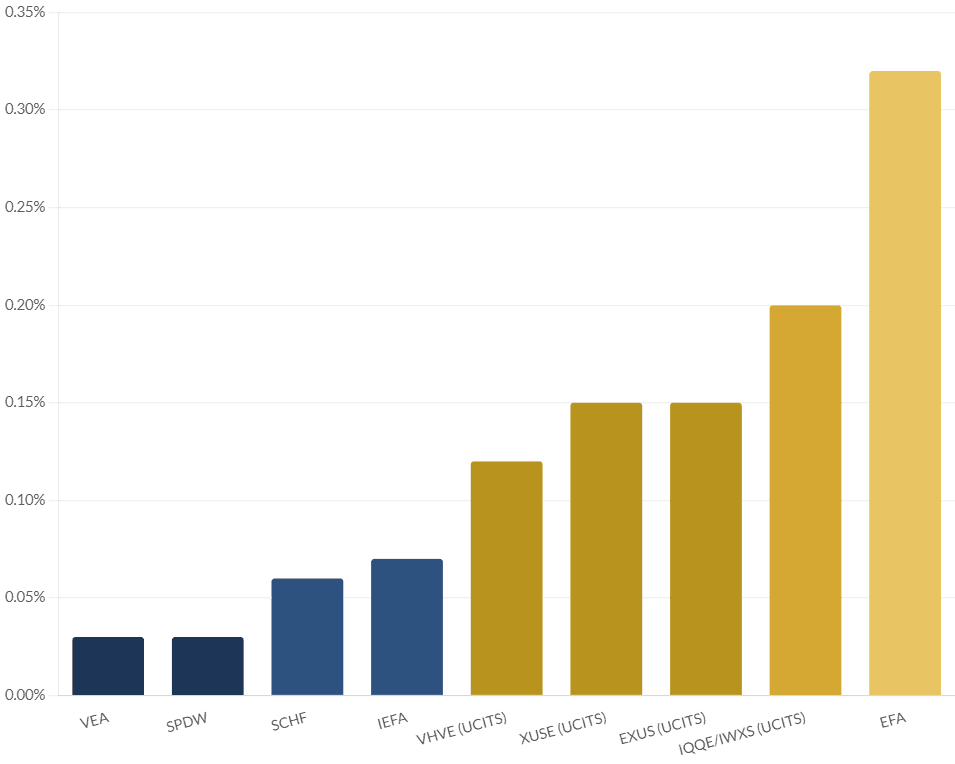
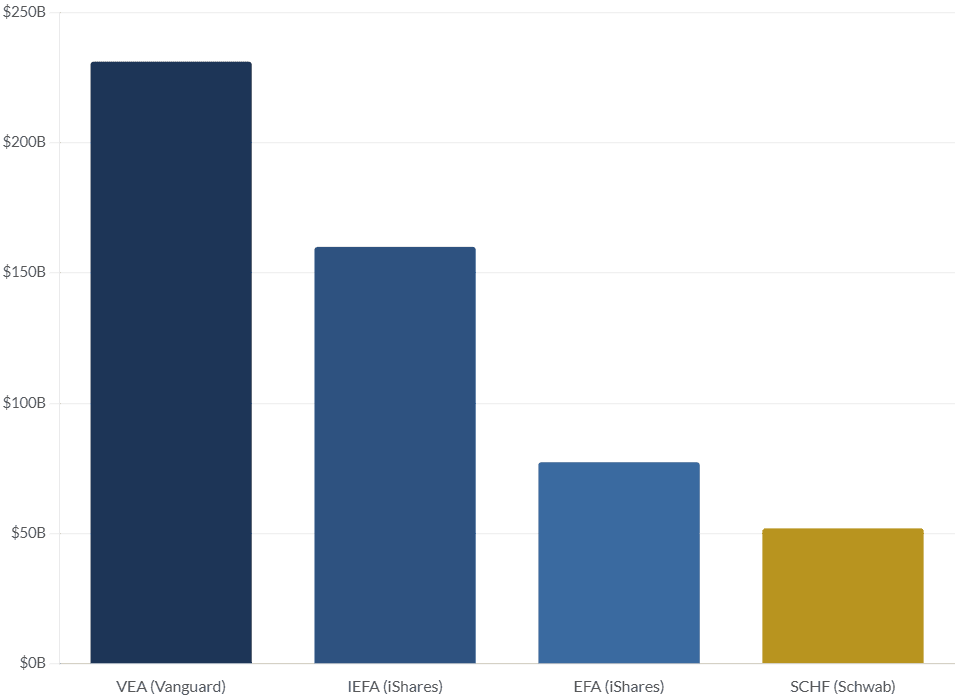
The Full ETF Menu
| Ticker | ETF Name | Issuer | Holdings | Structure |
|---|---|---|---|---|
| VEA | Vanguard FTSE Developed Markets ETF | Vanguard | ~3900 | Distributing |
| SPDW | SPDR Portfolio Developed World ex US ETF | State Street | ~2400 | Distributing |
| XUSE (UCITS) | iShares MSCI World ex USA UCITS ETF (Acc) | Blackrock | ~800 | Accumulating |
| IEFA | iShares Core MSCI EAFE ETF | Blackrock | ~2600 | Distributing |
Historical Annual Returns: The ex US Track Record
The criticism most frequently levelled against developed ex US equity is the last decade of performance. That criticism is valid: US equities have outperformed in every rolling 20-year window since 1970.
But within that long term record there are multi-year cycles where the international developed world has taken the lead, and 2025 was one of the clearest examples of that reversal in decades.
EFA, the longest running major ex US ETF and the most useful historic data proxy for this universe, delivered 11.23% in 2021, absorbed a 14.27% drawdown in 2022, recovered with 18.07% in 2023, edged to 3.43% in 2024, and then produced 31.38% in 2025, its best calendar year return in many years.
The 2025 surge was driven by a combination of dollar weakness, European fiscal stimulus, and global rotation away from overvalued US technology. Year to date through mid-2026, the broader UCITS vehicle XUSE has already returned 10.75%, while VEA, which includes Canada and South Korea, is up roughly 13.7% through May. The momentum behind the rotation appears durable rather than episodic.
The Valuation Gap in Numbers
The most powerful quantitative argument for the developed ex US trade sits in the P/E comparison. The S&P 500 trades at roughly 29.87 times trailing earnings. The MSCI ACWI ex USA, which blends developed and emerging markets excluding the US, sits at 20.6 times.
The MSCI World ex USA, the core benchmark for most instruments in this piece, trades at 19.15 times. The gap between the US and the rest of the developed world is roughly 56%. For that gap to be justified on a forward basis, US earnings growth would need to run materially and consistently ahead of international peers for an extended period. In 2026, consensus says that the gap has closed.
Macro Lens Takeaway
The investment case in mid-2026 is as clean as it has been in many years: a 56% P/E discount to the US, comparable earnings growth expectations, a sector profile that is structurally better positioned for the next cycle than the technology heavy US index, and a historical return track record that includes genuine multi year windows of outperformance, including the strong 2025 cycle just completed.
For an Indian investor running a US heavy portfolio by default through S&P 500 ETF exposure, adding a 15 to 20% weight in any of the instruments above materially improves geographic balance without sacrificing developed market quality.
The only judgment call is the Canada and South Korea question. MSCI based products exclude South Korea and include Canada. FTSE based products include both. Neither is right or wrong, they reflect two valid classification choices. What matters is that the investor understands which they own and does not inadvertently create a gap or an overlap by combining products from different index families.

